Reproducible and dynamic manuscripts/theses in R
More detailed explanation of Rmarkdown can be found at the RStudio Website or in the pandoc website (which is what R Markdown uses to convert to other documents).
This was the code shown for the session:
YAML Header
R Markdown files should have at the top a YAML header. YAML is just a series of settings to use for the document, like title, author, what document to create (Word, PDF, etc), where your bibliography is located etc.
---
title: "DNS session"
author: "Luke W. Johnston"
date: "November 30, 2016"
bibliography: sample.bib
csl: ama.csl
output: word_document
---
Code chunk
Code chunks allow you to insert R output (like results, plots, tables, numbers, etc) into the document. This is the primary strength of using R Markdown. Use Ctrl-Alt-I to insert a code chunk when using RStudio.
Headers
Inserting a header, such as Introductions or Methods, is easy:
# Header 1

## Header 2

### Header 3
Bolding and italics
To bold use **bold**. To italicize use *italicize*.
Some code used in the session:
library(captioner)
tab_nums <- captioner(prefix = "Table")
tab1 <- tab_nums("tab1", "This is the caption for table 1. Looking at the regression from the swiss dataset.")
#tab1

fig_nums <- captioner(prefix = "Figure")
fig1 <- fig_nums("fig1", "This is a caption for figure 1, showing a scatter plot.")
If you want to see the results, see Table 1.
library(pander)
pander(lm(Fertility ~ Education, data = swiss), caption = tab1, style = 'rmarkdown')| Estimate | Std. Error | t value | Pr(> | t | ) | |
|---|---|---|---|---|---|---|
| Education | -0.8624 | 0.1448 | -5.954 | 3.659e-07 | ||
| (Intercept) | 79.61 | 2.104 | 37.84 | 9.302e-36 |
Table: Table 1: This is the caption for table 1. Looking at the regression from the swiss dataset.
Including Plots
You can also embed plots here (see Figure 1), for example:
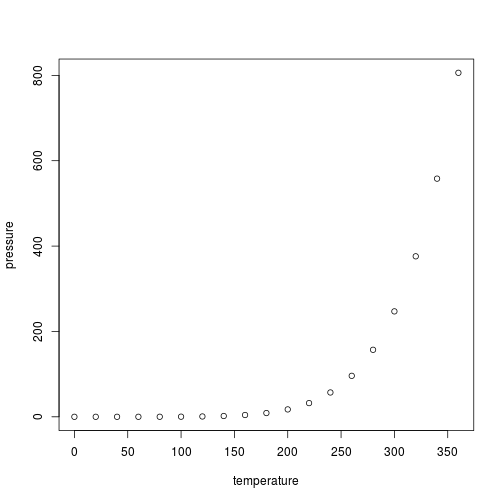
Note that the echo = FALSE parameter was added to the code chunk to prevent printing of the R code that generated the plot.
Inline numbers 70.14
Citations
library(curl)
curl_download("http://codeasmanuscript.github.io/code-along/misc/sample.bib", "sample.bib")
curl_download("https://raw.githubusercontent.com/citation-style-language/styles/master/american-medical-association.csl", "ama.csl")
According to certain authors blah blah [@Lash2007a]
These other authors say … [@An2013a; @Vandenbroucke2007a]
It’s good to have the last header be:
# References
… since the references will be inserted at the end.